
04

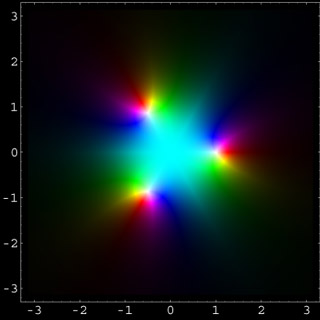
Here we see a colored density plot of a rational function with three poles of first order. The positions of the poles are given by the zeros of the denominator. These zeros are the third unit roots. The colors near the origin are between blue and green (cyan) indicating values near the negative real axis. Indeed, the function value at z=0 is -1.
You can see that the poles are of first order by considering a small circle around one of the white spots: Each color appears exactly once on this circle. The lines where the arguments of the function-value is Pi/3 (yellow) can be identified with good accuracy. The same is true for the lines with arguments Pi (cyan, i.e., negative real values) and 5Pi/3 (magenta). If we want to investigate the absolute values of this function, it is a good practice to combine the density plot with a contour plot of the absolute values. This is done here.