 |
|||
 |
01 |
||
| < Previous | Index | Next > | © 2004 B.Thaller | ||
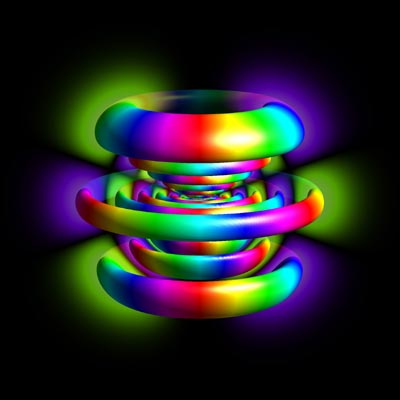
| This image shows a wave function describing the state |11,5,3> of the electron in the field of a proton (a hydrogen atom). The radius of the figure is about 200 Bohr radii. (1 Bohr radius = 5 x 10-11 m.) The proton is assumed to be at rest at the center of the image. It is way too small to be visible at this magnification. The visualization uses an isosurface of the position probability density to show the spatial structure of the wave function. The electron has a high probability to be found inside these colored tori. The wave function actually has no sharp borders. Therefore we use a slice plane with a colored density plot of the position distribution. The colors describe the complex phase of the wave function with the usual color map. All quantum numbers can be determined from this image (see Advanced Visual Quantum Mechanics, Chapter 2). The principal quantum number is n=11, the angular momentum quantum number is 5, and the magnetic quantum number is 3. Created with QuantumGL. |
|||