
Color map for complex numbers:
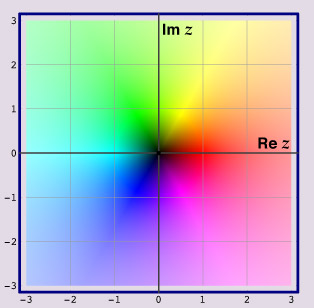
z = x + i y.
The set of complex numbers forms a two-dimensional plane (the "complex plane"). In the image to the left, each point (x,y) of that plane has a unique color (hue and lightness/saturation).
z = abs(z) ei arg(z)
The color map uses the HLS color system ("hue-lightness-saturation"). The hue represents the argument arg(z) of the complex number z. The absolute value abs(z) is given by the lightness of the color. All colors of the color map have the maximal saturation (with respect to the given lightness).
Positive real numbers always appear red. The primary colors appear at phase angles 2 pi/3 (green) and 4 pi/3 (blue). The subtractive colors yellow, cyan, and magenta have the phases pi/3, pi, and 5 pi/3.
The poles of a complex function are white, the zeros are black.
This color map is obtained by a stereographic projection from the surface of the three-dimensional color space (in the hue-lightness-saturation system) onto the complex plane.
Complex functions can be visualized using this color map with the help of Mathematica and the VQM packages.