05
exp(z)
Show contour plot
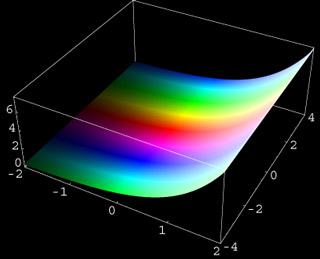
The exponential function exp(z) can be defined by its power series which converges everywhere in the complex plane (it is an "entire analytic function"). The exponential function has no zeros or poles. Writing z = x + iy we find the representation exp(z) = exp(x)*exp(iy) which shows that the absolute value is given by exp(x) and the argument is given by the imaginary part y of z. Hence the lines with the same absolute value are parallel to the y-axis. The gray contour lines in the image above show the absolute values 2, 4, 6,..., 20 (from left to right). The lines with constant phase are parallel to the x-axis and appear as stripes with the same hue. The exponential function is periodic in the y-direction (with period 2 Pi).
