 |
|||
 |
06 |
||
| < Previous | Index | Next > | © 2004 B.Thaller | ||
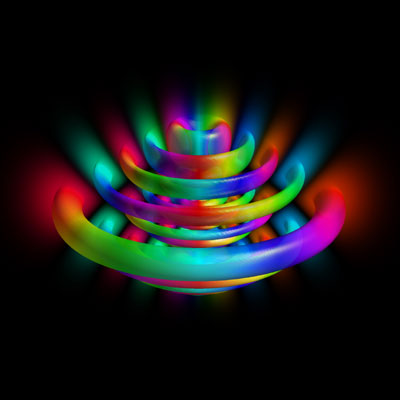
| Same as previous image, but a slightly different visualization method.
Hydrogen eigenstate obtained via separation in parabolic coordinates. The quantum numbers for this example are n1 = 6, n2=7, and m = 2 (see Advanced Visual Quantum Mechanics, Section 2.6.) This image combines an isosurface of the position probability density with a density plot in a slice plane. The colors describe the complex phases of the wave function according to the standard color map. Created with QuantumGL. |
|||